Let’s get back to basics and ask the questions: What’s a statistic? Why are statistics vital? What information counts as a statistic? This post will define and explain what constitutes a statistic and underline its value to daily life.
We see statistics every day, perhaps without even realizing it. So, let’s bring them to the foreground to understand how much impact they truly have.
Ready? Let’s get started!
Highlights:
- Statistics is the science of collecting, analyzing, presenting, and interpreting data.
- Two categories of statistics are inferential and descriptive.
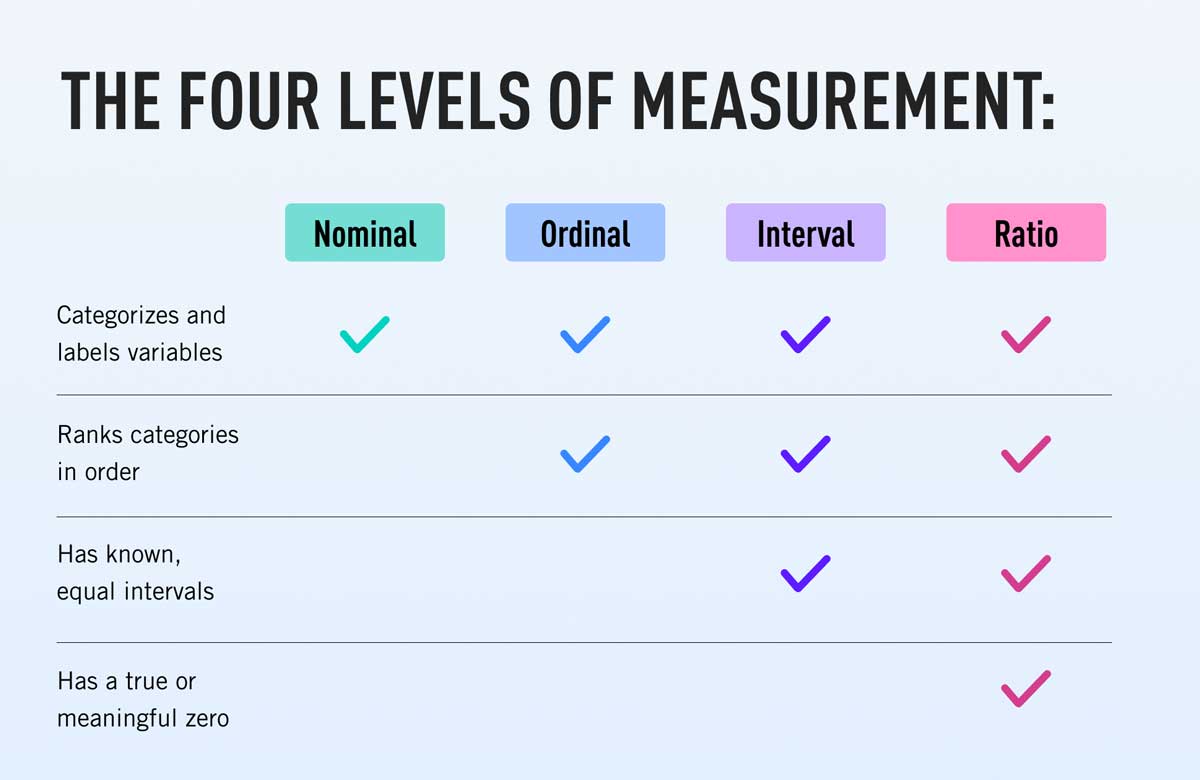
- Four levels of measurement in statistics are nominal, ordinal, interval, and ratio.
What is statistics?
According to the Encyclopedia Britannica, statistics is “the science of collecting, analyzing, presenting, and interpreting data.”
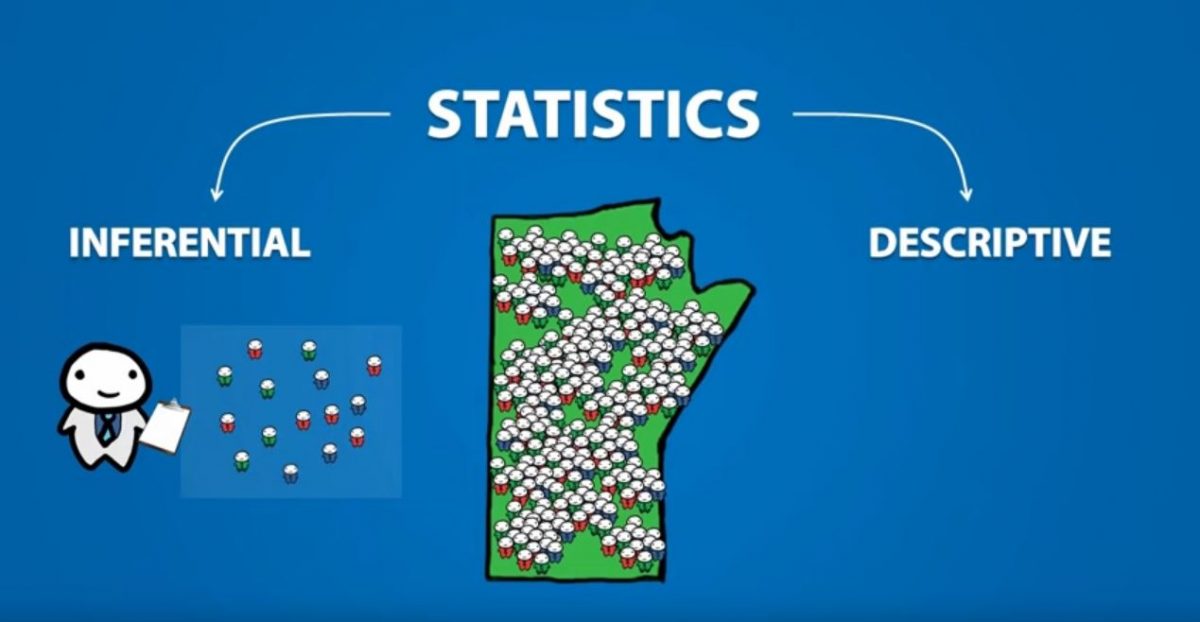
Next, let’s examine two categories of statistics: inferential and descriptive.
- Inferential statistics look at the data from the sample size and draw a conclusion based on it. For example, are left-handed people better at math than right-handed people? In this case, we could select 100 lefties and 100 righties and have them take the same math test. After reviewing the test scores, what can you infer? That’s inferential statistics.
- Descriptive statistics explain the data collected. For instance, if there are ten people in a room and two are women, a descriptive statistic would be that 20% of the people are female.

Why are statistics valuable?
Statistics play a huge role in our daily lives, and we make many of our decisions based on statistics.
Let’s look at some examples:
- The weatherman says that there’s a 65% chance of rain today. As a result, you take an umbrella when we go out.
- You posted a picture of a flower on Instagram, and it generated 50% fewer likes than other pictures you’ve posted. And so, you avoid flower pics for a while.
- You’re on Amazon looking for a pair of red sneakers. One product you like has four stars based on 52 customer reviews, while another has 4.5 stars based on 30,765 reviews. Because the latter one had a higher rating and more review, you purchase it.
- Your friend says he’ll meet you at the park at 3 pm. However, the last seven times he’s met up with you, he arrived 30 minutes late. So, you’re not in a rush to arrive on time.
As we can see, statistics are everywhere, and sometimes we don’t realize we’re using them!

What counts as a statistic?
What information can we consider a statistic? Again, for simplicity, let’s look at four variables that we count as a statistic.
1. Nominal variables
Nominal variables are data that have no number value. For example, hair or eye color, country, or state of residence are nominal variables. While you can place nominal variables in a particular order, but the order is arbitrary.
Based on this definition, which of the following statements does NOT use a nominal variable?
A. 40% of the students got an A on the math test.
B. 8 out of 10 ACME employees live in Springfield.
C. The average score on the Physics quiz was 85.
D. One-third of homeowners in Eureka have solar panels.
The correct answer is C. Letter grade on a test, town of residence, and solar panel usage are nominal variables.
2. Ordinal variables
Ordinal variables are an extension of nominal data, but the difference is that we assign an order to them (e.g., first, second, third). Also, there is no standard interval scale, so the intervals between variables don’t space out evenly.
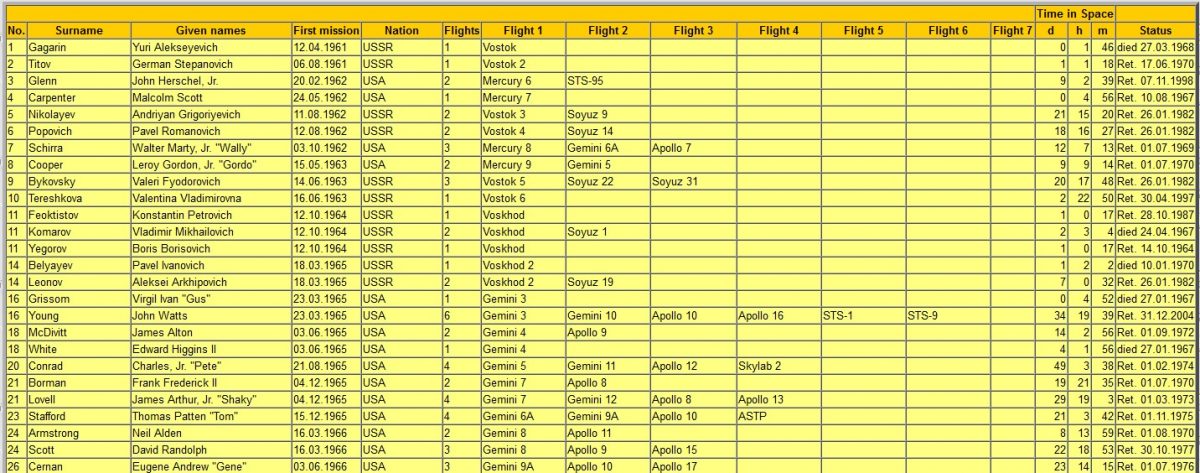
Let’s take an example. Here at StatsFind, we have a section called “Find the Firsts.” Let’s select an entry from this series: the first human in space. The following is a chart of first missions:

The statement “Soviet cosmonaut Yuri Alekseyevich Gagarin is the first human being to travel into space” is ordinal data because it satisfies three criteria:
- First, the data (humans in space) has no numerical value.
- Second, the rank is in date order and is the first in the order.
- Third, the interval scale is not standard. The next mission after Yuri’s was four months later. However, the mission after that was six months later. And the one after that was three months later.
3. Interval variables
Interval data, also called numerical, is evenly spaced out on a scale. Examples include time, temperature, and age. Interval data can be negative numbers but cannot have a zero value.
Based on this definition, which of the following statements DOES use an interval variable?
A. The very first website was info.cern.ch which went live in 1991.
B. The favorite instrument amongst the students is the drums.
C. Half of the customers reported less than satisfactory support.
D. Most Americans have a credit score of 711.
In this case, the answer is D. The lowest credit score a person can have is 300, while a perfect credit score is 850.
3. Ratio variables
Ratio variables meet all the criteria of interval data but also have a definition of zero value. Also, you can calculate ratios. For instance, temperature is an interval value but not a ratio value because 4 degrees Celsius is not half as cold as 8 degrees Celcius. However, weight is a ratio value because 50 lbs are half the weight of 100 lbs.
Other examples of ratio variables are height, distance, and mass.

Was learning about what counts as a statistic fun?
Did you enjoy this bird’s eye view of statistics? StatsFind regularly publishes articles on statistics and facts in current events and throughout history that pique interest.


