Thinking back to your last purchase, which device did you use to make the order? If it was a mobile phone, your transaction is among almost 75% of all ecommerce retail sales made by phone or tablet worldwide. What can businesses and users learn from mcommerce statistics for the upcoming year?
In a world where customer experience dictates the success of a business, understanding and adapting to buyer behavior is essential.
Let’s take a look at how mcommerce is reshaping the retail industry.
Highlights:
- Mcommerce is a subcategory of ecommerce and measures monetary transactions conducted with a mobile device, such as a smartphone or tablet.
- More than half of online users worldwide purchase from a mobile device.
- Mcommerce represents almost 40% of all retail sales in China
What is mcommerce?
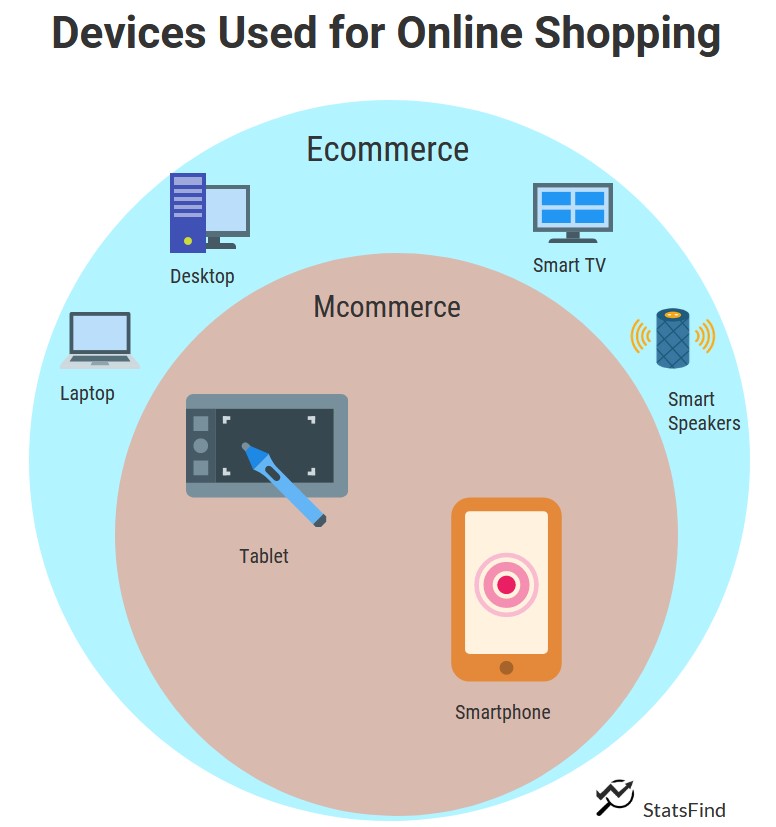
Mcommerce is a subcategory of ecommerce. Where ecommerce measures all electronic commercial transactions, mcommerce looks specifically at monetary transactions conducted with a mobile device (i.e., smartphone or tablet).

Kevin Duffee coined and used the term “mcommerce” at the Global Mobile Commerce Forum launch on November 10, 1997. Later that same year, the Coca-Cola company first implemented mcommerce in Finland. Customers in Helsinki could send SMS text messages to pay for their soda at two vending machines. Later, mcommerce application grew to include:
- Money transfer
- Mobile banking
- Online shopping
- In-app purchases
- Mobile marketing
The mcommerce statistics
Let’s look at four recent statistics relating to mcommerce. The first one is the most significant and will contain the bulk of business applications. The remaining stats add a unique layer.
Statistic #1: More than half of online users worldwide purchase from a mobile device[1]
As an aspect of digital transformation, businesses need to add or enhance the customer experience from a mobile device. Purchases from mobile devices will only become more popular. So, if your company isn’t optimizing the mobile experience, your competitor is.
Here are three examples where businesses can improve the customer experience for mobile users:
- Optimize web content for mobile phones and tablets – Make sure users see images and text clearly on their mobile devices. Also, the checkout process should be quick and seamless. The average global online shopping cart abandonment rate is 70%, with 46% of the reasons being issues related to the checkout process, namely:
- The site required the user to create an account to continue the checkout process
- The user couldn’t see the order total upfront.
- The website had errors or crashed.
- There weren’t enough payment methods.
- Offer a mobile app – Enable users to access your business through a mobile app. That said, the app should be on par or better than your website. Users will become easily frustrated with an app that contains a statement similar to the following:
- Use social commerce – Another subsection of ecommerce, social commerce measures commercial transactions that occur from social platforms. It can include clicking on links that direct users to a company’s website for the checkout process. Since, in most instances, a user accesses their social media account from their mobile device, social commerce is an excellent tool to leverage.
Statistic #2: By 2025, mcommerce will surpass 10% of total retail in the U.S.[2]
In 2021, mcommerce accounted for 5.9% of all retail sales in the U.S. Retail sales are products that consumers purchase, whether perishable or not, and includes purchases made in-store or from a catalog (i.e., offline sales).
Brick and mortar stores can take advantage of mcommerce’s relatively low share and growth has in total retail. You can plan and execute a more substantial online presence, including mobile channels. Therefore, use the time to get ahead of the revolution.
Statistic #3: By 2025, smartphone commerce will represent 90.7% of total retail mcommerce in the U.S.[3]
More than 50% of digital shoppers purchased using a tablet in 2021. Furthermore, research showed that over 75% of tablet shoppers would buy something on their device, compared with 62.6% of smartphone shoppers.
Smartphone users tend to start or continue their customer journey with their phone but complete a transaction through another device. However, as the buying experience improves on smartphones, analysts project that purchases made from tablets will decrease by over 50% by 2025.
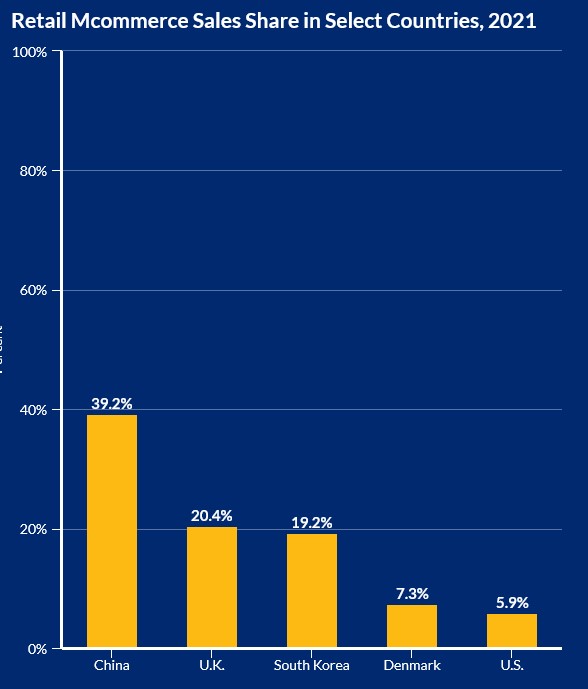
Statistic #4: In 2021, China had the most prominent retail mcommerce sales[4]
Mcommerce represents almost 40% of all retail sales in China. The U.K. followed in second, South Korea in third, Denmark in fourth, and the U.S. in fifth place.

If you’re looking to market to buyers in China, here are a few recommendations:
- Since over 75% of smartphone users in China use Android, ensure your website and apps work on Android.
- WeChat is the dominant social messaging app in China. It also has a wallet feature, where users can link to their bank or credit card for online payments. So, invest in a WeChat store.
- Your company can no longer have nine to five business hours. It should be available 24 hours a day and have excellent customer support.
Enjoyed the breakdown of mcommerce statistics?
Did you enjoy this overview of mcommerce? StatsFind regularly publishes articles on statistics from various fields, trending topics, and events throughout history that pique interest.


